Executive Summary
This leasing report provides an analysis of the Atlanta residential rental market, highlighting key trends and factors affecting leasing activity. Despite the recent decline in leasing activity, the long-term case for Atlanta’s multifamily market remains intact given the undersupply of housing, which has been exacerbated by increased construction costs, rising interest rates, and the high cost of homeownership. This, in turn, should drive demand for rental housing, both apartments and single family. Nationwide, however, including Atlanta, leasing activity has been impacted by inflationary pressures, leading to limited household formation especially among the low-to-moderate-income segments.
Market Overview
According to analysis by Realtor.com, there is a gap of 6.5 million homes built relative to new household creation. Moreover, data from the National Low Income Housing Coalition shows that the US has a shortage of 7.3 million affordable rental homes. This current undersupply of housing should drive demand for rental housing. Increased construction costs, rising interest rates, and the high cost of homeownership contribute to the undersupply. Despite this, Atlanta’s leasing activity has declined, particularly in low-to-moderate-income properties due to inflationary pressures.

Year-over-year rent growth in Atlanta turned negative in Q2 2023, underperforming the national average and historical average. Absorption slowdown is noticeable in 1-3 star multifamily properties, indicating limited household formation among low- and middle-income groups. Inflation in Atlanta remains higher than in other metro areas.
Last year, the Federal Reserve declared that not one of the 13 counties that make up the Atlanta Metro qualified as affordable housing. In many places, monthly housing costs consume more than 40% of income, well beyond the 30% that we require for renter approval. The median price for housing in Atlanta has doubled over the last 10 years. Its suburbs have seen median home prices increase by 43% since 2020, while median income only grew 1.7% in that time.
Vacancy Rates
Atlanta’s overall vacancy rate for multifamily is 9.9%, with 3-star properties experiencing a slightly lower rate of around 9%. Although possibly contradictory to common wisdom, this has been true historically based on this data source since 2017 with 4- and 5-star properties historically having a higher vacancy of ~3%. In discussing with local property managers, the general consensus is that higher quality properties might exhibit higher vacancy rates than lower quality in Atlanta because all of the new building that takes place in Atlanta is for 4- and 5-star properties meaning that all of the new supply is in this segment of the market.

Submarket vacancy rates vary widely, however, to note a few significant vacancy rates, Clayton County is performing at a lower rate of 10.2% while Midtown Atlanta has a rate of 12.8%.

Household Formation
Lower demand for leasing in Atlanta is likely due to lower household creation caused by higher inflation, and the higher cost of living. The median number of new households created per year in the US is 1.3 million over the last 50 years, but in the decade following the Great Financial Crisis, only 10.2 million households were created, 3 million fewer than expected.
The number of households created contracted in 2020 by 128k due to COVID, but rebounded in 2021 by 773k and 2022 by 2 million. Although data isn’t currently available, forecasters believe that household creation has decreased significantly in 2023 from the 2022 levels and is now trending below the historical mean with a return to multigenerational living.

Comparison with Camden Property Trust for multifamily
Camden Property Trust, a public REIT operating in the A and B+ segment of the market, has experienced a decrease in occupancy of 2.9% in Atlanta and forecasts an additional 1% increase in vacancy. Camden’s rental units in Atlanta are not a good comparison to E & E’s typical assets under management given the superior location, but it provides some insights into the local market that institutional operators are expecting further declines in occupancy.
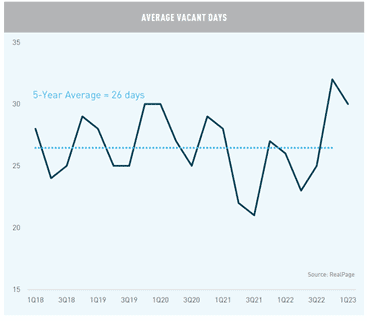
On a market wide basis, according to data by Berkadia, after two years of elevated demand, the once scorching hot multifamily market is showing signs of cooling down. Compared to one-year prior, vacant apartments were filled almost one week faster and more people were applying for the same rental. According to a RentCafe report, eight renters are competing for vacant apartments this year compared to 11 last year.

Class C apartments are impacted the most by this negative trend.

Comparison with Tricon Residential for single family
Tricon Residential is a large publicly traded single family REIT with over 37,000 single family homes primarily located in a number of major metro areas in the Sunbelt. Its portfolio is mostly comprised of Class B+ to A properties 3-4 beds, and 2000 + year built. Its average monthly rent is $1,767. Its rent growth has moderated recently but has still been able to achieve 12% increase on re-lease and 6.5% increase on renewal. During the pandemic period it was achieving 20% increase on re-lease and 5-6.5% on renewals.
In comparison, E & E is achieving on average for single family homes 27.8% increase on re-lease and 20.4% increase on renewals in 2023. Our Average rent is $1510 for Class C to B- homes, generally comprised of 2 bed- 3 bed homes in Class C areas.

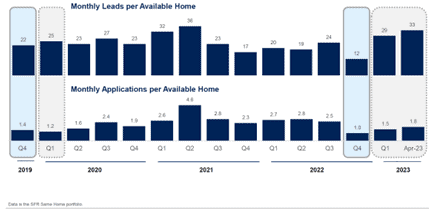
Demand indicators for leasing, such as leads and applications per available home experienced a dip in Q4 2022 that suggested more than seasonal weakness. Monthly leads per available home were 12 on average and applications 1 on average relative to 17 and 2.3, respectively in 2021 and 23 and 1.9, respectively in 2020.
E & E is on average seeing 2-3 applications submitted per week per property. Lead flow is quite significant, however, if we measure just by application links sent to prospective tenants it is on average 12 leads per home per week.

The Zillow supply data of total available homes per month in Tricon’s metropolitan markets hit a mid-pandemic trough of 3,800 in Q2 2021 and has increased to 13,600 in Q1 2023, more in-line with pre-pandemic levels. This is about 100% higher than the average of 6,800 from Q3 2020 to Q3 2022.

Macroeconomic Data and Demographic Trends
The long-term thesis for owning rental properties is supported by strong macroeconomic data.There has been a gap between housing demand and the completion of housing units since the Great Financial Crisis.

Young adults living at home represent pent-up demand that could increase leasing activity in the future. Delayed homeownership decisions among young adults favor apartment rentals.

To further support the long-term thesis of strong demand for rental housing going forward, here is a positive demographic trend given that young adults are choosing to marry and have children later in life, delaying homeownership decisions and pushing people into renting.

Marketing Statistics
Large property managers for multifamily assets in Atlanta for B class properties target the following:
- An average of 3-7 daily leads
- 35% conversion rate from leads to tours
- 35% conversion rate from tours toapplications
- 75% applications to approvals
- 9% prospect to lease
In reality, the application to approval rate on average for these property managers is currently around 25-30%, reflecting lower credit quality among tenants and the impact of the eviction moratorium during COVID. Given that these targets are for higher quality properties than we are managing, we have set the following targets
- An average of 5-8 daily leads
- 20-35% conversion rate from leads to tours
- 35-45% conversion rate from tours to applications
- 20-30% applications to approvals
- 2-5% prospect to leases
Conclusion
Despite the recent decline in leasing activity, the long-term outlook for the Atlanta multifamily market remains positive. The undersupply of housing, coupled with strong macroeconomic data and demographic trends, supports the thesis for owning rental properties. While inflationary pressures and limited household formation among low-to-moderate-income segments have affected leasing activity, there is potential for increased demand in the future. It is crucial to monitor market conditions and adjust marketing strategies accordingly to attract tenants with improved credit quality.
More specifically to the actions we are taking on our portfolios, to effectively reduce future vacancy rates and mitigate fraudulent activities, we have integrated Findigs into our operations. Findigs enables us to enhance tenant screening processes, ensuring that we secure highly qualified tenants and minimize delinquency issues. Furthermore, in response to the growing concern of job losses within our portfolio, we have recently implemented a program called, The Guarantors, a service that provides rental guarantees and additional security deposits. These proactive measures add an extra layer of security and reassurance for our business.
To strengthen our marketing efforts, we have adopted a comprehensive strategy that includes Google Ads and Chat GPT. Leveraging these platforms enables us to reach a wider audience and engage with potential tenants more effectively. We are also conducting A/B testing to optimize our marketing campaigns, ensuring that we are utilizing the most effective strategies to attract and retain tenants.
As part of our commitment to exceptional customer service, we regularly benchmark ourselves against industry competitors. We are currently focusing on improving our response time and have implemented various measures to exceed industry standards. Through ongoing efforts and meticulous monitoring, we believe that we are surpassing our competitors in terms of customer service quality and response time.
By leveraging the capabilities of Findigs and The Guarantors, alongside our continuous marketing enhancements and dedication to superior customer service, we are confident in our ability to reduce future vacancy rates and maintain a rental portfolio that performs to both our and our investors’ expectations.


